Document classification is a classical machine learning problem. If there is a set of documents that is already categorized/labeled in existing categories, the task is to automatically categorize a new document into one of the existing categories. In this blog, I will elaborate upon the machine learning technique to do this.

We have an existing set of documents (D1-D5) that are categorized into Auto, Sports, and Computer.

Document # Content Category
D1 Saturn Dealer’s Car Auto
D2 Toyota Car Tercel Auto
D3 Baseball Game Play Sports
D4 Pulled Muscle Game Sports
D5 Colored GIFs Root Computer

Now the task is to categorize the new D6 and D7 into Auto, Sports, or Computer.

Document # Content Category
D6 Home Runs Game ?
D7 Car Engine Noises ?

In machine learning, the given set of documents used to train the probabilistic model is called the training set.

The problem can be solved by the classification technique of machine learning. There are several machine learning algorithms that can be tried out, including:

  • Pipeline
  • BernoulliNB
  • MultinomialNB
  • NearestCentroid
  • SGD Classifier
  • LinearSVC
  • RandomForestClassifier
  • KNeighborsClassifier
  • PassiveAggressiveClassifier
  • Perceptron
  • RidgeClassifier

Feel free to try out these algorithms for yourself; I found Multinomial Naive Bayes to be one of the most effective algorithms for this purpose.

In this blog, I will also provide an application of Multinomial Naive Bayes. I recommend going through the following topics to build a strong foundation of this concept.

  1. Conditional Probability
  2. Bayes Theorem
  3. Naive Bayes Classifier
  4. Multinomial Naive Bayes Classifier

Applying Multinomial Bayes Classification

Step 1

Calculate prior probabilities. These are the probability of a document being in a specific category from the given set of documents.

P(Category) = (No. of documents classified into the category) divided by (Total number of documents)

P(Auto) = (No of documents classified into Auto)divided by (Total number of documents) = 2/5 = 0.4

P(Sports) = 2/5 = 0.4

P(Computer) = 1/5 = 0.2

Step 2

Calculate Likelihood. Likelihood is the conditional probability of a word occurring in a document given that the document belongs to a particular category.

P(Word/Category) = (Number of occurrence of the word in all the documents from a category+1) divided by (All the words in every document from a category + Total number of unique words in all the documents)

P(Saturn/Auto) = (Number of occurrence of the word “SATURN” in all the documents in “AUTO”+1) divided by (All the words in every document from “AUTO” + Total number of unique words in all the documents)

= (1+1)/(6+13) = 2/19 = 0.105263158

The tables below provide conditional probabilities for each word in Auto, Sports, and Computer.

Auto

Word # of Occurrences of Word in Auto Total Words in Auto Conditional Probability of Given Word in Auto # of Total Unique Words in All Documents
Saturn 1 6 0.105263158 13
Dealers 1 6 0.105263158 13
Car 2 6 0.157894737 13
Toyota 1 6 0.105263158 13
Tercel 1 6 0.105263158 13
Baseball 0 6 0.052631579 13
Game 0 6 0.052631579 13
Play 0 6 0.052631579 13
Pulled 0 6 0.052631579 13
Muscle 0 6 0.052631579 13
Colored 0 6 0.052631579 13
GIFs 0 6 0.052631579 13
Root 0 6 0.052631579 13
Home 0 6 0.052631579 13
Runs 0 6 0.052631579 13
Engine 0 6 0.052631579 13
Noises 0 6 0.052631579 13

Sports

Word # of Occurrences of Word in Sports
Total Words in Sports Conditional Probability of Given Word # of Total Unique Words in All Documents
Saturn 0 6 0.052631579 13
Dealers 0 6 0.052631579 13
Car 0 6 0.052631579 13
Toyota 0 6 0.052631579 13
Tercel 0 6 0.052631579 13
Baseball 1 6 0.105263158 13
Game 2 6 0.157894737 13
Play 1 6 0.105263158 13
Pulled 1 6 0.105263158 13
Muscle 1 6 0.105263158 13
Colored 1 6 0.105263158 13
GIFs 1 6 0.105263158 13
Root 1 6 0.105263158 13
Home 0 6 0.052631579 13
Runs 0 6 0.052631579 13
Engine 0 6 0.052631579 13
Noises 0 6 0.052631579 13

Computer

Word # of Occurrences of Word in Computer Total Words in Computer Conditional Probability of Given Word in Computer # of Total Unique Words in All Documents
Saturn 0 3 0.0625 13
Dealers 0 3 0.0625 13
Car 0 3 0.0625 13
Toyota 0 3 0.0625 13
Tercel 0 3 0.0625 13
Baseball 0 3 0.0625 13
Game 0 3 0.0625 13
Play 0 3 0.0625 13
Pulled 0 3 0.0625 13
Muscle 0 3 0.0625 13
Colored 1 3 0.125 13
GIFs 1 3 0.125 13
Root 1 3 0.125 13
Home 0 3 0.0625 13
Runs 0 3 0.0625 13
Engine 0 3 0.0625 13
Noises 0 3 0.0625 13

Step 3

Calculate P(Category/Document) = P(Category) * P(Word1/Category) * P(Word2/Category) * P(Word3/Category)

P(Auto/D6) = P(Auto) * P(Engine/Auto) * P(Noises/Auto) * P(Car/Auto)

= (0.4) * (0.052631579) * (0.157894737)

= (0.00005831754)

P(Sports/D6) = 0.000174953

P(Computers/D6) = 0.00004882813

The most probable category for D6 to fall into is Sports, because it has the highest probability among its peers.

P(Auto/D7) = 0.00017495262

P(Sports/D7) = 0.0000583175

P(Computers/D7) = 0.00004882813

The most probable category for D7 to fall into is Auto, because it has the highest probability among its peers.

The Multinomial Naive Bayes technique is pretty effective for document classification.

Before concluding, I would recommend exploring following Python Packages, which provide great resources to learn classification techniques along with the implementation of several classification algorithms.

I hope you enjoyed reading this. If you have any questions or queries, please leave a comment below. I highly appreciate your feedback!

This episode of Take 3 centers around a discussion of the importance of accessibility on the web and beyond. 3Pillar’s Jessica Hall and Jenna Warren join us in the studio to explore the options available for making the web a more accessible place for everyone.

Episode Highlights

  • Jessica gives a comprehensive definition of “accessibility” and she and Jenna discuss why digital accessibility is important for every user, not just disabled users
  • We talk about the recent controversy surrounding SweetGreen’s mobile app and why the push for better accessibility isn’t a recent phenomenon
  • Jenna and Jessica offer ways for companies to improve their online accessibility, as well as how to fit these measures into their existing product development procedures

About the Guests

Jessica Hall is the Director of Product Consulting at 3Pillar Global, where she helps clients from startups to enterprises get the most out of their product investments.

Jenna Warren is a Client Partner in the Information Services Technology vertical at 3Pillar Global. She is responsible for the overall success of 3Pillar’s engagement with clients.

On this episode of The Innovation Engine, we talk with the founder and president of the Chamber of Digital Commerce, Perianne Boring, about the promise of blockchain technology and how regulatory actions in the financial services space will either accelerate or suffocate the next wave of tech-fueled innovation in the sector.

Among the topics we discuss are the role of government here in the U.S. in fintech as compared to other countries, how public policymakers are approaching and learning about financial innovation, and why creating a friendly regulatory environment for financial innovation is one of the most important initiatives in policy today.

Listen to the Episode

Interested in hearing more? Tune in to the full episode of The Innovation Engine below.

About Perianne Boring

Perianne Boring is the founder and president of the Chamber of Digital Commerce, which first opened its doors in July 2014. She currently oversees the Chamber’s operations and government affairs and public policy initiatives. Perianne previously worked in network broadcast news and as a Forbes contributor, after beginning her career working on Capitol Hill as a legislative analyst advising Representative Dennis Ross on finance, economics, tax, and healthcare policy.

About The Innovation Engine

Since 2014, 3Pillar has published The Innovation Engine, a podcast that sees a wide range of innovation experts come on to discuss topics that include technology, leadership, and company culture. You can download and subscribe to The Innovation Engine on Apple Podcasts. You can also tune in via the podcast’s home on Spotify to listen online, via Android or iOS, or on any device supporting a mobile browser.

Show Notes

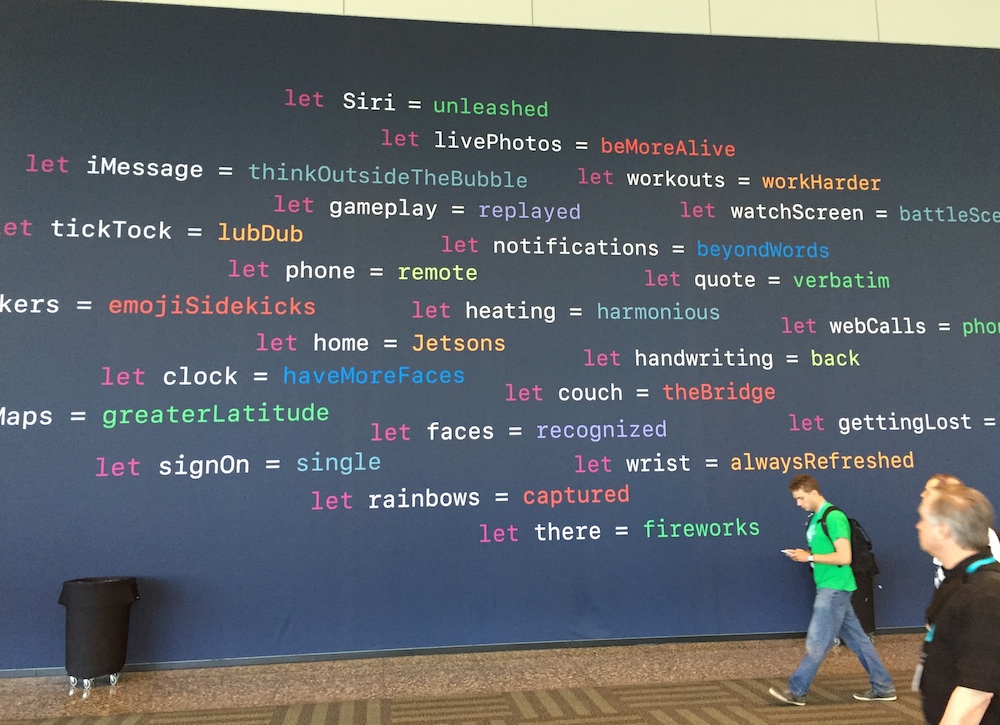
In this episode of Take 3, we continue the conversation about WWDC 2016 – Apple’s Worldwide Developers Conference – with 3Pillar’s Sean Kosanovich. He joins us in the studio to talk about his experience at the latest WWDC, how it compares to previous years, and what to look forward to from Apple.

IMG_1944

Episode Highlights

  • Sean discusses how WWDC has evolved over the years and his excitement over the shift of focus from Objective C to Swift
  • We talk about what Apple’s choice to open its services to third party developers will mean for the future of both the development community and Apple’s reputation
  • Sean shares the story of how he met Apple royalty at this year’s WWDC

About the Guest

Sean Kosanovich is a Senior Software Engineer at 3Pillar with a background in full-stack development and a focus on native mobile applications.

Sean and Craig Federighi, Apple's SVP of Software Engineering.
Sean and Craig Federighi, Apple’s SVP of Software Engineering.

To watch Craig Federighi’s portion of the WWDC keynote, tune in on Apple’s website. Craig’s portion of the keynote runs from 35:25 to 66:15.

Read the Transcription

Julia Slattery: As someone who has attended the last three WWDC conferences, what can you say about how it has changed and evolved over the years?

Sean Kosanovich: Honestly, not much has changed, and that’s I think a good thing. The most valuable part of conference is the sessions and the one-on-one time you get with Apple developers. And if anything, that has increased over the years, so that’s a good thing since that’s the most valuable. There were a couple of small changes that I’ve noticed; in previous years, obviously Swift was very new and a lot of the sessions were still in Objective-C. However, this year, every session was all done in Swift and I think that really points to Apple’s future and where they’re going. They have kind of phased out Objective-C from their developer conference.

Julia Slattery: What would you say was the highlight of your experience this year?

Sean Kosanovich: So this year, like I had mentioned earlier, was all about Swift. And being a big Swift lover, for me, seeing Swift mature was really cool. Back in December, Swift was open sourced and the community is really taking to it. So Swift 3, which is going to be out this fall, has been a collaboration between Apple engineers and the open source community. And the biggest goal with Swift 3 is to be source compatible moving forward. So what that means, as you write Swift 3 code now, when Swift 4 and 5 come out in the future, it will still work and you won’t have to change it. That’s been a big pain point for developers. A lot of developers have always complained about why are they changing the syntax, why are they doing this, they can’t get it right. But I think people fail to realize that Swift isn’t even three years old yet, and Objective-C is over 20 years old. So it’s not a mature language yet and seeing that maturity coming in now is awesome.

Going back to the open source community, IBM actually did one of the presentations at WWDC. They’re kind of going all-in on Swift. They have an open source web framework that runs on Linux, so you could run your Swift code in the cloud. And I think it’s going to be huge to have one language you could write for the cloud and for your mobile apps, because Swift is now ported to Android as well. So you could use one language to do the complete package. It’s really cool and I think this is the draw of like Node.JS or Meteor for web applications, you could use JavaScript on the server and client side. And I think this is that huge moment for Swift where it is going to really take off.

Julia Slattery: One of the biggest announcements from the conference was that Apple is making more of its services available to third-party developers. Do you think this is just a response to the other voice services like Amazon’s Alexa? How do you think this will impact the development community?

Sean Kosanovich: Yeah for sure. A lot of the iOS 10 features has been about expanding through extensions with the Apple’s core applications, and certainly some of the extensions are in response to competitors such as Alexa. Before I get into that, some of the extensions that they did allow were iMessage apps, so I really think this is probably a response to stuff like Facebook Messenger, WeChat, and Slack. They’ve had these rich chat platforms for a while that can do apps and stickers and all these fun things that consumers like. And I do think that that’s going to really resonate with users and maybe even pull people into the iMessage ecosystem as well.

Another extension point is with Siri. As you probably saw, Siri is quasi-open to developers. I say quasi because it’s not a full-on API like Amazon’s Alexa or Google’s new voice assistant. But this is definitely a direct response and Apple is kind of taking a very cautious approach by only opening it up to certain things like paying friends or ordering an Uber, for example. It’s very limited to what they can do; I’m assuming Apple is doing this so they can better control the experience and then expand from there, but it’s definitely not entirely up to the Alexa API yet. Apple also added extension points for Maps. So now you can do restaurant reservations or order an Uber directly in the Apple Maps application, which is really cool because I think the less moving around users have to do between apps to accomplish a task, the better. And I think it’s just going to make a much better experience.

Then the last two were these rich notifications in home screen widgets. So the rich notifications, it’s essentially you can have a widget as your notification and allow users to interact with your app without actually having to open it to do common stuff like respond and stuff like this. In the home screen widgets, when you 3D touch on an app icon, you could actually display a widget right there on the home screen that users can interact with. So they don’t even need to open your app. And I think, again, this is really going to help enhance the user experience.

I do have one concern, and I think that if this is executed well, the new extension points are really going to resonate with users. However, opening up your core applications to third-party developers can lead to some issues. Now Apple’s quality – which a lot of the times they are known for not having an extreme number of bugs and so forth – could be impacted. So if the Uber app is poorly coded for – I’m not saying it is, but for example, if the Uber app was poorly coded and it’s crashing the Messages app or the Maps app or Siri, a lot of users – they don’t really know the difference between what’s responsible, they’re just going to see their phone crashing all the time. So I really hope that Apple is going to take a much harder review stance on applications that are going to integrate with the core apps. And if they do that, I think this will be a really useful feature for the users.

Julia Slattery: There’s also been some buzz around Apple’s iOS 10 release being a copy of Google’s latest OS, and it’s going to start a mobile war. Do you think this will bring about the dawn of a new mobile age?

Sean Kosanovich: Yeah I think the mobile industry as a whole has kind of hit this plateau. If you look at the new Android mobile operating system, AndroidN – which is in beta now – it borrows a lot of features from iOS that it’s had for a couple of years, such as split screen multitasking, picture-in-picture and actionable notifications. These are things that iOS had for years. So Google was blamed for copying Apple and now we have Apple playing catch up to Google.

I think the industry is really looking for the next big innovation. I don’t think it was there with 3D touch or touch ID because they are easily copied by other device makers. So I think the mobile industry as a whole is looking for a new innovation and until that new innovation comes along, whenever that is, I think there is going to be a lot of copy, give-and-take between Apple and Google and the Windows phone and so forth.

There were a couple other features that Apple announced that people have really made a point that Google has had this for a long time. One of those is Apple’s new photos application on iOS 10 can now recognize objects and scenes. This is something that if you’ve used Google photos, you can go to Google photos and search for snow and it’s going to turn back every picture in your library that has snow in it. Google does this by doing server-side algorithms on the back end, which is a machine learning technique. So what it learns maybe from your picture, it’s going to use that same data on Bob’s pictures. It’s not very good for privacy but it gives you a really cool feature. iOS 10 is actually going to have the same exact feature, this object and scene recognition. However, Apple is not doing it in the cloud; they are doing it on the device and they are doing that for privacy reasons. So even though Apple is playing catch-up in the end-user feature, Apple is really concerned with the user privacy and they are just doing it in a different way from Google.

Julia Slattery: So since the last WWDC, Apple announced the large 12.9 inch Pro and the 4 inch iPhone SE. Did Apple follow this trend and announce any new tools this year to help developers accommodate the new screen sizes?

Sean Kosanovich: Yeah certainly. One of the new features of Xcode 8 is an interface builder called “Preview.” Preview allows developers to see how their applications look on the varying devices without having to actually compile and run the application. This is going to save a ton of time.

Across the bottom toolbar of Interface Builder, there is now every device that your app is targeted – from the larger iPad Pro all the way down to the smallest iPhone – and you could choose in between any device and orientation and see exactly how your app is going to look in real time. Another really cool thing with Preview is, you can actually select which devices you want to edit your layout for. So maybe you have a label you only want to be shown on the larger screen iPads – you can just select those iPads, do your edits and hit save and now that label will only be for that iPad. That’s going to help developers a lot with this adaptive UI. Apple took it even a little bit further – a lot of developers are probably used to constraints or they are probably more used to fighting with constraints in auto layout, but now Interface Motor automatically generates your constraints for you based off your current layout, which is really cool. For the times that the constraints aren’t right and you have runtime issues where something is not looking quite like you hoped it would be, Interface Builder, the new view de-bugger, can actually point these out and it’s not an archaic mess of random unique ID constraint errors. So there’s been a lot of changes there to help developers create adaptive apps.

Julia Slattery: I heard that you had a brush with Apple royalty while you were at the conference. Could you tell that story?

Sean Kosanovich: Yeah certainly. Always keep your eyes open for Apple executives, as they often walk around the conference just randomly. And one day, I was sitting off to the side doing some work and someone comes down next to me and I look up, and it’s actually Craig Federighi, who is Apple’s Senior Vice President of Software Engineering. He just casually sat down next to me like he was any other attendee, and he pulls out his MacBook and he starts doing some work. At first, I wasn’t sure if it was him because it was just so casual the way he sat down, but then I started talking to him and we talked at least for a good 10-15 minutes, just about everything. He was asking what I do, how I was liking the conference, and he asked about 3Pillar Global. So that was really cool. At the end, before I had to get going, I asked him for a picture. And I think it was at that time that everyone else realized that it was Craig Federighi because then there was a huge line of people wanting to take a picture. So that was kind of funny.

Julia Slattery: That’s awesome.

Sean Kosanovich: Yeah, it was a lot of fun.

Julia Slattery: What a great story to come away with.

Sean Kosanovich: Yeah, right? I was joking with people that I knew were there, that Craig and I are buddies now.

Julia Slattery: Obviously, you got a picture two years ago, and now you’ve got a picture this year.

Sean Kosanovich: So we must be best buds now.

Julia Slattery: That’s exactly what it means.

For a very special episode of The Innovation Engine podcast, we welcome 3Pillar CEO David DeWolf back into the studio for our 100th episode. David was the very first guest to appear on the podcast, and he has been on the podcast numerous times to discuss technology trends and corporate leadership.

For this episode, we talk about David’s journey as an entrepreneur and the path he has taken over the course of the last 10 years to go from a company with fewer than 10 employees at the outset to one that now has more than 700 employees worldwide. Among the keys David cites as critical to his success are a true passion for what he does and the ability to hire the right people and then trust them to do their jobs well.

We also discuss some of the trends that were the hottest topics at this summer’s major technology conference, including the invasion of the bots and the connected home.

Listen to the Episode


About David DeWolf

David DeWolf is the Founder and CEO of 3Pillar Global, one of the Mid-Atlantic’s fastest growing technology companies. Since founding 3Pillar in 2006, David has guided the company to a leadership position in the Product Development Services sector, establishing 3Pillar as the go-to innovator for content, information, and data-rich companies looking to grow revenue through software.

David is passionate about software product innovation, entrepreneurship, and principled leadership. In 2012, he was named one of SmartCEO Magazine’s “Future 50.” In 2011, he was recognized by the Washington Business Journal as one of “40 Under 40” who are Washington, D.C.’s brightest young business leaders. He writes frequently about leadership, business, life and technology at DavidDeWolf.com. David and/or his writing has appeared in publications like Fortune, Fast Company, Investor’s Business Daily, Pando Daily, ZDNet, and many more.

About The Innovation Engine

Since 2014, 3Pillar has published The Innovation Engine, a podcast that sees a wide range of innovation experts come on to discuss topics that include technology, leadership, and company culture. You can download and subscribe to The Innovation Engine on Apple Podcasts. You can also tune in via the podcast’s home on Spotify to listen online, via Android or iOS, or on any device supporting a mobile browser.

Show Notes

In my previous post on understanding data for analysis, I described the common approaches for the analysis of single variables. In this post, I’ll summarize the common approaches for analyzing the relationships between multiple variables in your data. Why is an analysis of the relationships important? Let’s start with a paradox.

Simpson’s Paradox

An intriguing effect is sometimes observed when the analysis of single variables leads to a trend that reverses or disappears when the variables are combined or the effect of confounding variables are taken into account. In the fall of 1973 at UC Berkeley, there were allegations of gender bias in the graduate school admissions. It was observed that men had a 44% admission rate against 35% for women, a difference that was unlikely to be caused by a random anomaly.

However, a breakup of the admission rates by all departments revealed that the allegations were not true. The conclusion from the new data was women tended to apply to competitive departments with low rates of admission while men tended to apply to less competitive departments with higher rates of admission. The moral of the story is it is important to analyze the relationships between variables.

Covariance

Covariance is a measure of the tendency of two variables to vary together. Covariance is expressed as:

cov

  • X, Y are two series
  • dxi and dyi are the difference of each data point from the sample mean x and sample mean y
  • n is the length of the series samples (both samples must be the same size)

Additionally, Python libraries, such as NumPy, account for corrections from small sample sizes. Covariance is interpreted as:

  • If two variables vary together, the Covariance is positive
  • If they vary opposite to each other, the Covariance in negative
  • If they don’t have an effect on each other, the Covariance is close to zero

Pearson’s Correlation

Covariance is rarely used in summary statistics because it is hard to interpret. By itself, it does not provide a sense of how much the two variables vary together, but only their ‘direction’ (if you consider each series to be a vector). The unit of Covariance is also confusing because it is the product of two different units. Pearson’s Correlation divides the Covariance with the product of the standard deviations of both series resulting in a dimensionless value.

pcov

Pearson’s Correlation is bounded in [-1, 1].

  • If it is positive, the two variables tend to be high or low together
  • If it is negative, the two variables tend to be opposite of each other
  • If it is zero or close to zero they don’t affect each other

Sx, Sy are the standard deviations of the X, Y series respectively. Standard Deviation (σ) is a measure of the spread of the distribution.

Crosstabs

Crosstabs (short for cross tabulations) are counts of the intersection of two categorical variables (while Covariance and Correlations hold true for continuous variables). For example, if you have two categorical variables – X with values (1, 2, 3) and Y with values (‘A’, ‘B’, ‘C’), a crosstab will be a 3×3 matrix that counts the number of times each value occurs together in the data set.

X/Y

A

B

C

1

234

25728

1237

2

26

0

57

3

13549

144

4235

Crosstabs are suggested only when you suspect a relationship between two categorical variables as the matrices can become large and hard to analyze.

Spearman’s Rank Correlation

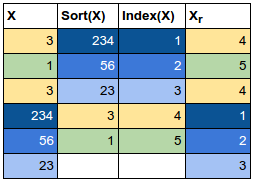
Pearson’s Correlation is misleading in the face of non-linear relationships between the variables and if the variables are not normally distributed. It is also susceptible to outliers. Spearman’s Rank Correlation corrects for these effects by computing the Correlation between the ranks of each series. The rank of a value in the series is its index in the sorted list. The computation of the Spearman’s Rank Correlation is more expensive than Pearson’s Correlation because it involves sorting the two series or computing the ranks by index hashing. The formula is the same as Pearson’s correlation, but the series X, Y are the ranks of the values in the original series. This is best explained with a table – follow the colors to see the value to rank transformation:

spear

The formula can be expressed as:

spear-form

Are we there yet?

We know enough to analyze a wine quality data set, obtained from UC Irvine’s archives. The data set has 11 input variables and one output variable – quality – that was assessed by expert testers. The input variables are: fixed acidity, volatile acidity, citric acid, residual sugar, chlorides, free sulfur dioxide, total sulfur dioxide, density, pH, sulfates, and alcohol.

It helps to have some domain knowledge of the data set as you can use this knowledge to avoid calculating correlations for known relationships and detect spurious correlations as well. This data set, however, is small enough to compute a correlation matrix for all the input variables.

Correlation Matrix

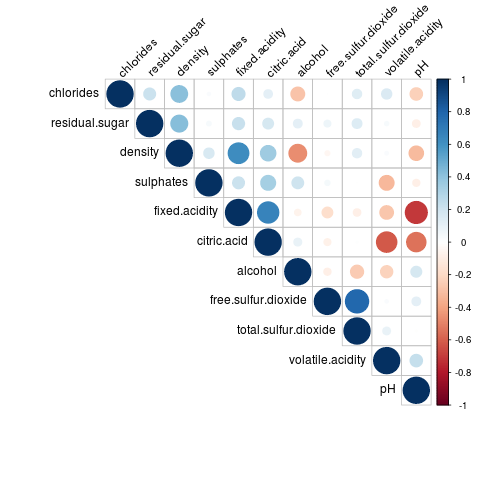
A correlation matrix denotes the correlation coefficients between the input variables. Let’s additionally add a dash of data visualization to the matrix so that we don’t end up staring at numbers. This is called a Correlogram.

I analyzed the input variables and observed that they did not conform to a normal distribution. I also compared the Pearson’s correlation and Spearman’s Rank correlation coefficients for a couple of input variables and found significant differences. Given these observations, I decided to compute the matrix using Spearman’s Rank correlation. Using R:

df <- read.csv("winequality-red.csv", header=TRUE, sep=";")
idf <- df[,1:11]
mcor <- cor(idf, method=c("spearman"))
#install.packages("corrplot")
library(corrplot)
corrplot(mcor, type="upper", order="hclust", tl.col="black", tl.srt=45)

This is what we get:

r-correlogram

What can we decipher from the Correlogram?

  • Fixed acidity and pH are negatively correlated, as is pH and citric acid. This is expected and you can use expectations of such relationships to check the validity of the data.
  • Density and alcohol are negatively correlated. Is this a spurious correlation?
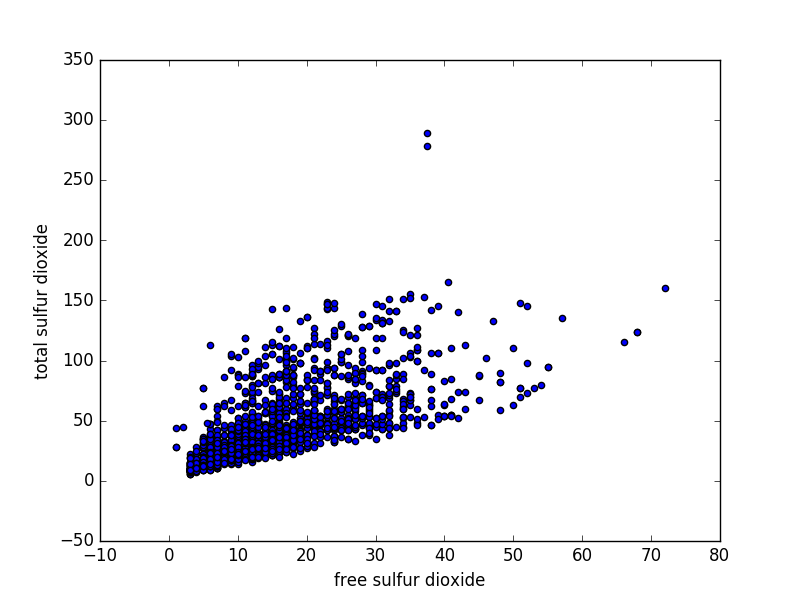
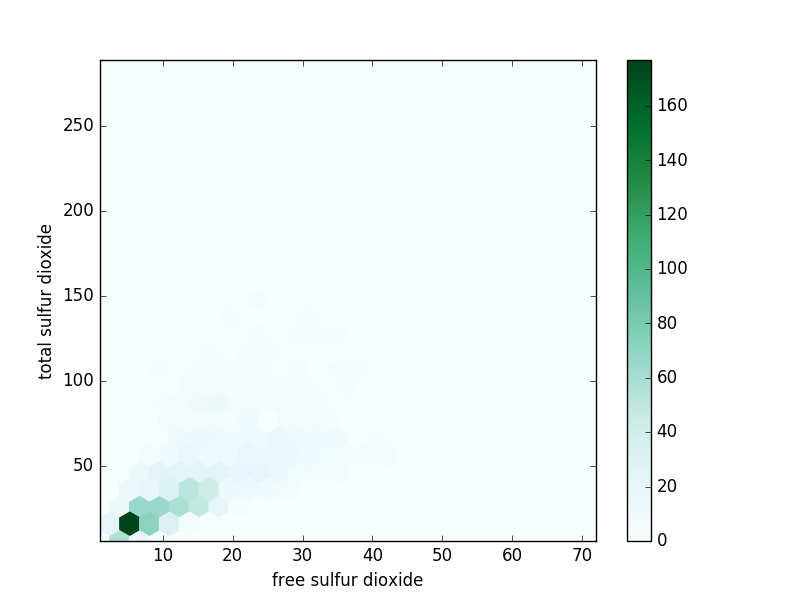
  • Total and free sulfur dioxide are positively correlated.

Scatter Plots

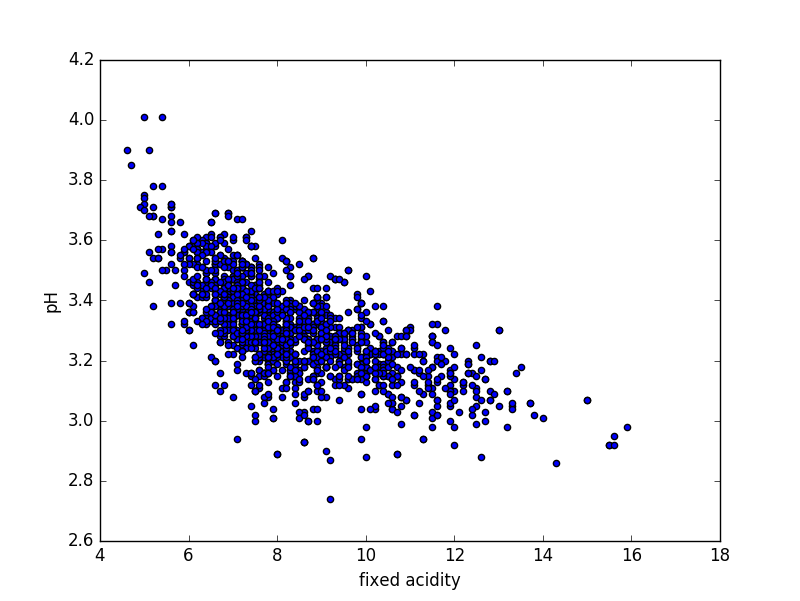
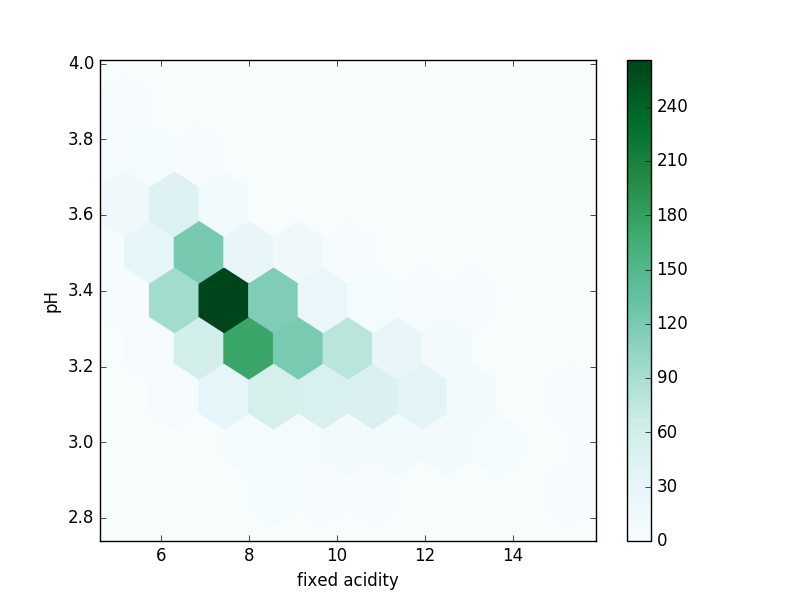
Scatter Plots are a simple way to visualize the relationship between two (or more) variables. For two dimensions, they plot the location of the data point. The more correlated the variables are, the narrower a band towards which the plot tends. Scatter plots can become confusing when there are a large number of points or outliers ; hexbin plots are used in these cases. A hexbin plot divides the graph into hexagonal bins and colors each bin according to the number of points in each bin.

Let’s draw scatter and hexbin plots for pH versus fixed acidity and Total versus free sulfur dioxide. Using Python:

import pandas as pd
import matplotlib.pyplot as plt

columns = ["fixed acidity", "volatile acidity", "citric acid", "residual sugar", "chlorides", "free sulfur dioxide", "total sulfur dioxide", "density", "pH", "sulphates", "alcohol"]

df = pd.read_csv("winequality-red.csv", sep=";")
df.plot.scatter(x=columns[0], y=columns[8])
df.plot.hexbin(x=columns[0], y=columns[8], gridsize=10)
df.plot.scatter(x=columns[5], y=columns[6])
df.plot.hexbin(x=columns[5], y=columns[6], gridsize=25)
plt.show()


scatter-fa-ph

Scatter plot – fixed acidity vs pH

hex-fa-ph

Hexbin plot – fixed acidity vs pH

scatter-sulfides

Scatter plot – free vs total sulfur dioxide


hex-sulphides

Hexbin plot – free vs total sulfur dioxide

Conclusion

There are a couple of interesting things worth mentioning:

  • The Anscombe’s Quartet are datasets that have similar simple summaries but appear very different from each other on a scatter plot. The datasets were created to underline the importance of visualizations for the analysis of data.
  • It is tempting to deduce a slope from the scatter plots; however, this can be misleading. The Wikipedia page on correlations has a section on linear, nonlinear input variables and their scatter plots. They show it is possible to have a perfect correlation of 1 or -1, yet have very different slopes.

Single and multiple variable summaries provide you with a starting platform for a data audit strategy. You need to couple this with effective visualizations to understand your data and check for misleading summary statistics.

On this international episode of Take 3, 3Pillar’s Marius Banici and Sayantam Dey join us all the way from Romania and India, respectively, to discuss the present and future of machine learning.

Machine learning is a study of pattern recognition and computational learning in artificial intelligence. It has recently been used by major companies to help businesses analyze their data.

Episode Highlights

  • Marius and Sayantam give us a brief overview of machine learning and discuss why it has been a topic in recent news
  • We talk about the machine learning platforms offered by companies like Amazon, Google, and Microsoft, and how they are changing the way businesses use big data
  • Marius and Sayantam bring more depth to the discussions they began with their earlier blog posts and dive into what’s coming with the future of machine learning

About the Guests

Marius Banici is the Senior Director of 3Pillar Global’s Advanced Technology Group. In this role, he is responsible for creating a culture of technical excellence and innovation throughout the company by leading 3Pillar’s advanced technology teams in support of our Labs initiatives, engineering teams, and clients.

Sayantam Dey is the Director of 3Pillar’s Advanced Technology Group. He has been with 3Pillar for a decade, delivering enterprise products and building frameworks for accelerated software development and testing in various technologies. His current areas of interest are data analytics, messaging systems, and cloud services.

Read the Transcription

Julia Slattery: So let’s start with the basics, what is machine learning?

Marius Banici: Machine learning is a subfield of computer science that gives computers the ability to learn without being explicitly programmed. It uses algorithms that can learn from and make predictions on data instead of following strictly static instructions.

Sayantam Dey: Another way to think about it is we started off by telling the computer specifically what to do and how to process a set of instructions. Machine learning takes that one step further and says that okay this is the data that I have, deduce from it certain knowledge or a certain pattern and then if I give you a new input, predict what the output would be. So it goes from imperative style to a knowledge-based machine making style.

Julia Slattery: Why has it become such a hot topic of conversation recently?

Marius Banici: Well this is a Renaissance of the artificial intelligence. This is the result of the latest years’ massive advancements in some key areas. First, it’s computing power, then cloud accessibility. Also, we see huge volumes of data generated by the penetration of Internet connectivity and powerful mobile devices. Lastly, algorithms and tools evolved and are available to the general public. We can say that it’s the perfect storm for artificial intelligence, and machine learning is a key part of it.

Sayantam Dey: And the key aspect is the availability of the data that is there. So back when we didn’t have almost all of this data and the computation part, the focus was on creating perfect modeling. So let’s say your local weatherman, if they were trying to predict the weather, they will take the data and try to build the perfect mathematical model that would take your last week’s weather patterns and predict the next week’s weather patterns. Now, with the amount of data and with the amount of processing power that we have to deal with cloud and GP and other such infrastructure, the focus has gone on to simpler items that get better with a lot of data. So now your typical weatherman does not need to spend so much time on building the perfect model, but rather on making sure that model gets enough data to keep improving itself and its accuracy.

Julia Slattery: So companies like Amazon, Google, and Microsoft offer machine learning as a service for businesses to better understand their data. Can you describe the platforms that they offer and how this is changing the way businesses use big data?

Marius Banici: Yes, so these big players have seen the need for and potential in getting more meaning from data. And as part of their cloud offering, they created services – that can be easily incorporated by companies – for using data analytics and machine learning to improve their products. If a company is using one such major service provider, we will find a relatively painless way to incorporate it and then have a better understanding and better serve their clients with personalized interaction. It allows us to incorporate user context and aggregate many data sources. And it’s accessible to incorporate and use those new technologies in their future services and products.

Sayantam Dey: Okay, let’s roll back and figure out why these services are being offered in the first place. So like we saw in the last decade or so, there has been an explosion in the number of tools and solutions that are there for business intelligence. Business intelligence focuses on trying to make sense of the data that you or a company has collected over the course of a certain time period – two years, five years. It tries to answer the question “Where are we today?” in terms of the business. If we can define some key performance indicators – what are those key performance indicators, how do those key performance indicators work, are we above a certain threshold, are we below a certain threshold. There are lots of players, but there very much are solutions in this space. The same thing is now beginning to happen in the BI space with all these guys offering up their services and even you could add Tesla as a player in there.

So at this point, I think, as an analyst, what is most useful to me is if I need to run experiments on certain sets of data that might be really big – like even gigabytes or terabytes, in the case of Amazon – I can take the data that is already stored on their stream, which Amazon makes available to me as long as I’m using Amazon infrastructure. And then I can run multiple experiments on it to see which is the best of those that performs with a given set of data. So as an analyst, that speeds up my work considerably because I don’t have to invest in getting the infrastructure and setting up and maintaining it. So that’s the major advantage.

Julia Slattery: You mentioned Tesla there, could you expand on that?

Sayantam Dey: Yeah, so they are trying to open up a platform called Mobile Eye. It’s not out there in the public domain yet, but they are also trying to provide services like Amazon and Microsoft.

Marius Banici: Yes, they are democratizing using artificial intelligence by making it available to everyone and open sourcing it as much as possible.

Julia Slattery: So how do you see machine learning impacting not only the way businesses perform, but also the way data is used and understood?

Marius Banici: I think machine learning is the key for mastering the volume and complexity of the data that is produced. It will push forward pervasive computing and will bring us new ways to understand our world and make discoveries, and also automate many things in our lives.

Sayantam Dey: Yeah, like I was mentioning in the previous question, we saw the rise of the BIE big companies trying to use BI. So companies that have data and understand the performance metrics would now like to make some bets on what future strategies they might take in the sales, or the marketing, or even in the everyday business operations. These guys are poised to sort of take on the machine learning aspect of it and say okay, fine, we know these are our KPIs, we know that this is what we do well, this is what we don’t do well, based on this can we demonstrate and offer our operating parameters in the future. So for example, the classic case of the customer churn, as in “How long am I able to keep a customer on my commerce site or on my portal that I have?” These are questions that are very important because they define overall the sales strategy and market strategy – I mean how you contact your customers, which customers you contact. So like Marius said, it’s going to touch every aspect of the business sooner than later.

Julia Slattery: What does the future of machine learning look like? You kind of touched on this, but could you expand on it a bit?

Marius Banici: The same way we see today that most companies are shifting to cloud computing and it became ubiquitous, I think in a few years, machine learning will be operated in most of the software that we build.

Sayantam Dey: I agree with that. I mean, it’s going to take the shape of how BI has become ubiquitous in business. People will figure out where and how to use machine learning in their business. There are certain aspects of it that are very glamorous right now. For example, chatbots. There’s a lot of hype around chatbots and it’s glamorous, Facebook is doing it, Microsoft is doing it, Google is doing it, but eventually people will figure out what is the best chatbot to use and where to use them. So yeah, it’s going to get into that slope of enlightenment pretty soon.

Julia Slattery: You both have written about machine learning related topics for the 3Pillar website in the past. Can you touch on what those blog posts are about, and some of the tools or uses cases that you wrote about?

Sayantam Dey: My blog posts center around statistical analysis, which is a precursor to machine learning. We can say the machine learning is actually an extension of statistics. Statistics deal with mathematical models, which we call parametric models, and machine learning takes it to the next level or takes it to another branch of it and looks at non-parametric models where you don’t make any assumptions about the data. So that’s what I have been writing about.

I think one thing that we probably should touch upon is that none of this is based in math and in statistics. I don’t know if our listeners are looking to partner with people to work on machine learning problems. I think it’s important for them to, at this point, not to get swayed by tools; instead, they should be talking to people who have a background in statistics and who have a background with solving mathematical and related problems.

Marius Banici: Yeah, I think around the solutions that we build, we can point to typical use cases; one is understanding natural language. We can have very good results with the available technologies and libraries and everything to get plain English text and be able to understand it and come up with smart answers. The second thing is aggregation of different sources of data and then creating services that incorporate social media, web, IoT, and everything around us for a better experience. And that is again about machine learning. When we speak about the tools used, for example, by Amazon, a major advantage is how easy it is to incorporate it. You will be able, with a set of data, to use machine learning to learn from your data and be able to drive predictions based on the past experience. And that can happen quite easily in a matter of weeks, but as Sayantam said, with the right knowledge on theoretical models behind it, statistics, probability, mathematics.

Splunk is an enterprise platform to analyze and monitor a wide variety of data like application logs, web server logs, clickstream data, message queues, OS system metrics, sensor data, syslog, Windows events, and web proxy logs in many supported formats. Splunk provides a simple but powerful interface to quickly get insight out of the contextual data. In this post, I will showcase the power of data exploration using Splunk.

Analysis

To analyze the data, it must first be loaded into Splunk. I have downloaded a sample of Apache web server logs from http://www.splunk.com/base/images/Tutorial/tutorialdata.zip. The log shows events that are time-stamped for the previous 7 days.

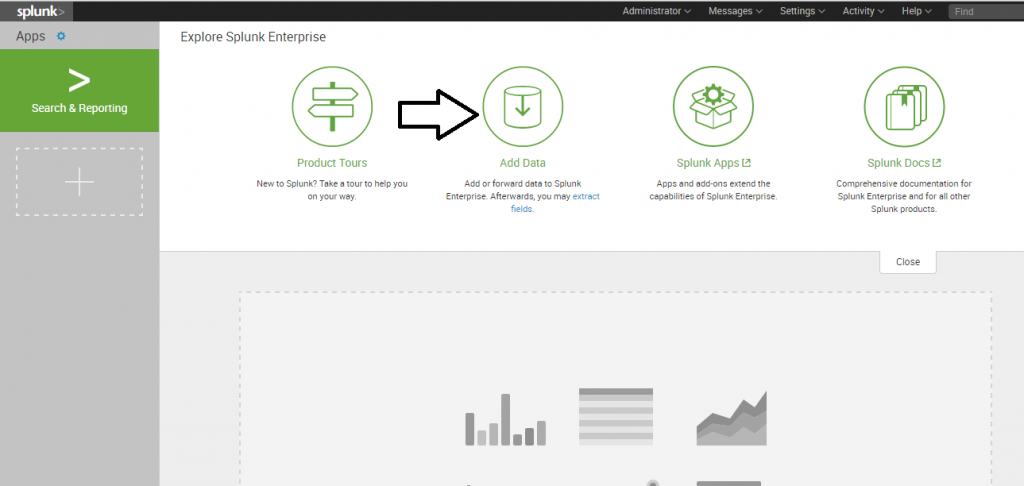
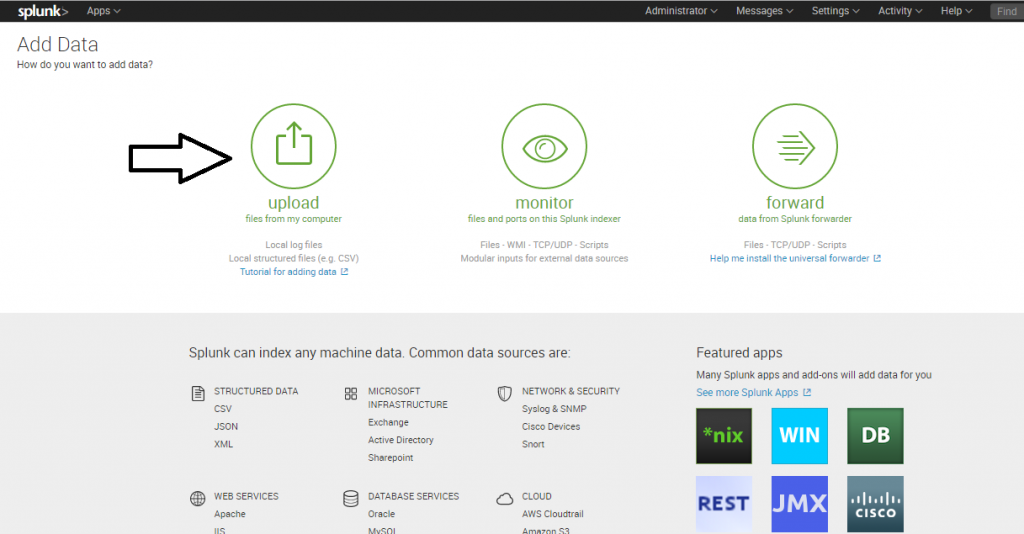
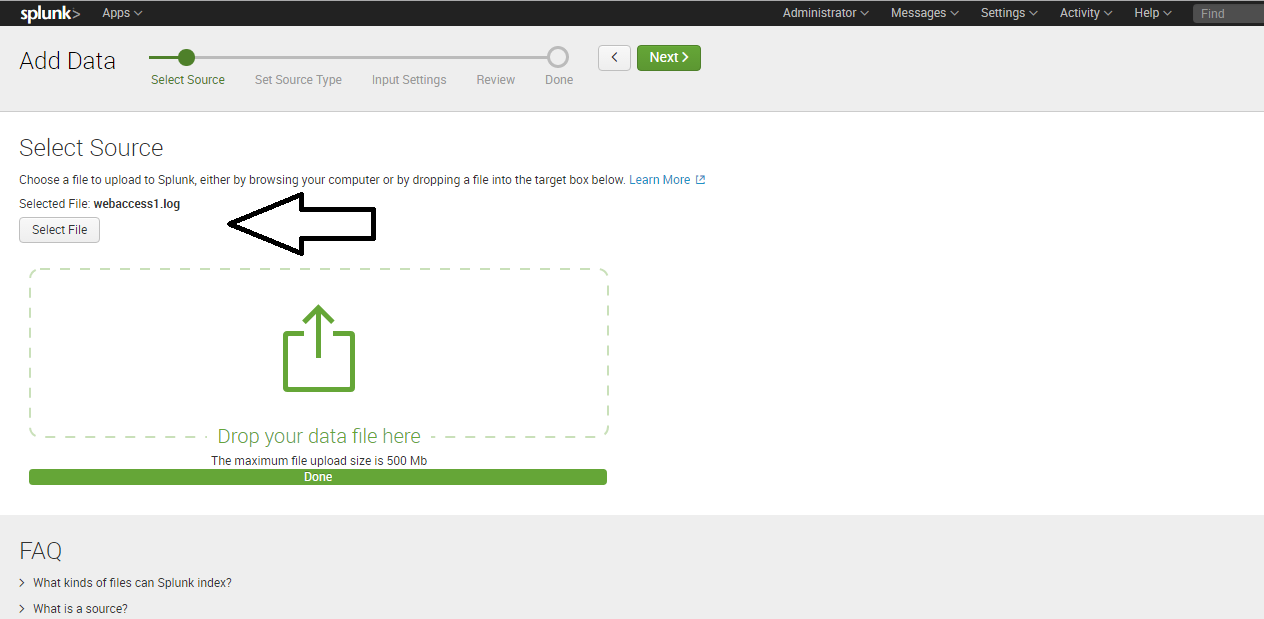
To start, upload the Apache logs into Splunk as shown below:

Upload data into Splunk
Add data into Splunk


03

Follow the wizard steps. This will provide you with the search/query screen where you can do a detailed analysis over the data.

Here are some of the patterns that I derived out of the data:

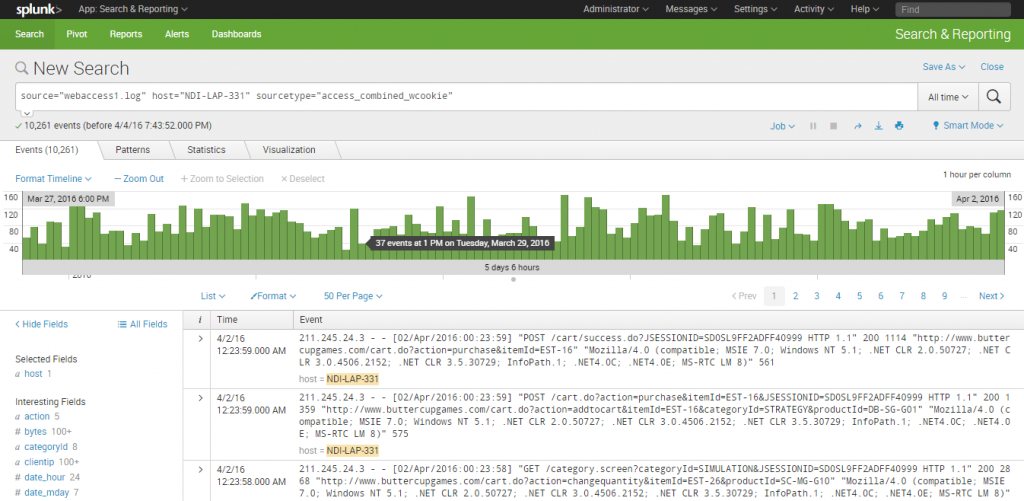
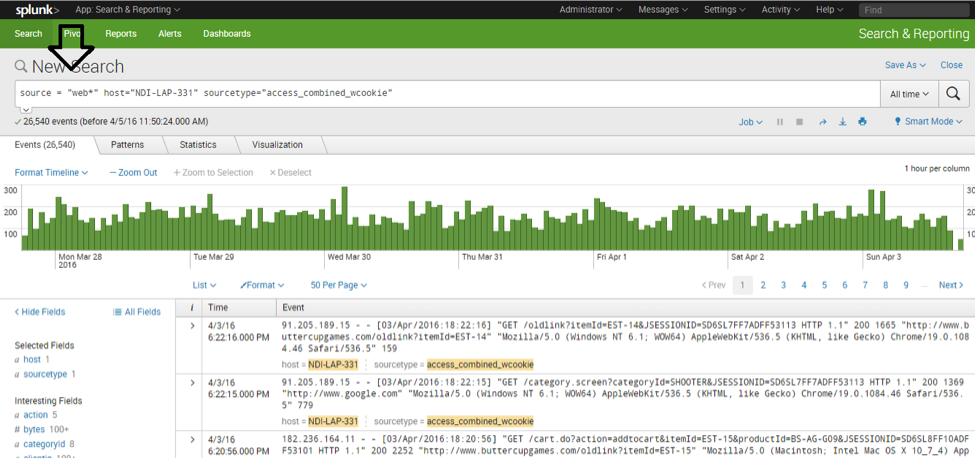
1. Overall traffic patter: The overall pattern of traffic to the website is generated by default.

Overall Traffic Pattern


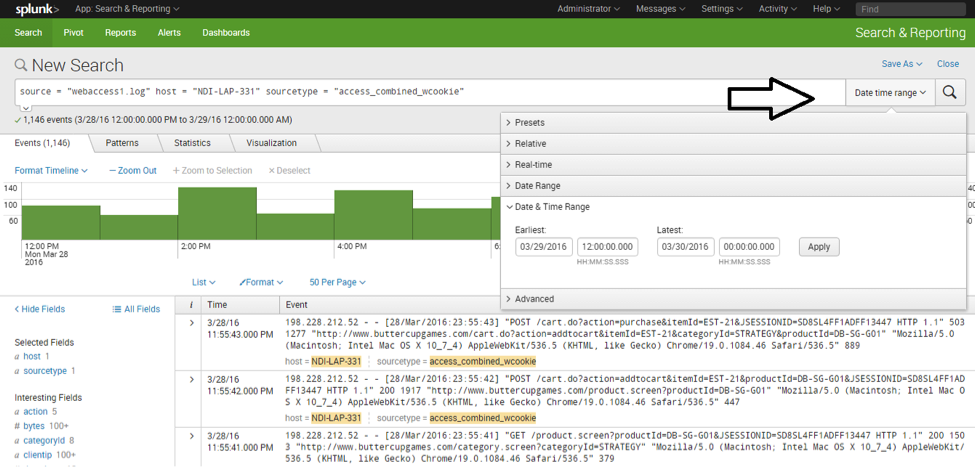
The pattern is for multiple days, but you can choose single day pattern from “date time range.”

splunk1

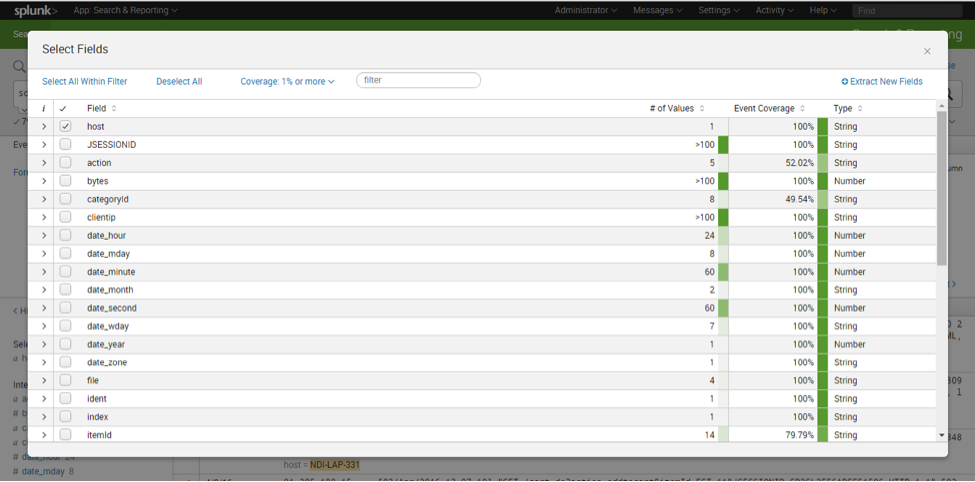
You can explore queries on more fields by clicking the “All Fields” link on the left.

splunk2

Multiple source files can be consolidated to do a comprehensive analysis. Upload a new log file and use a similar operation as shown below:

splunk3

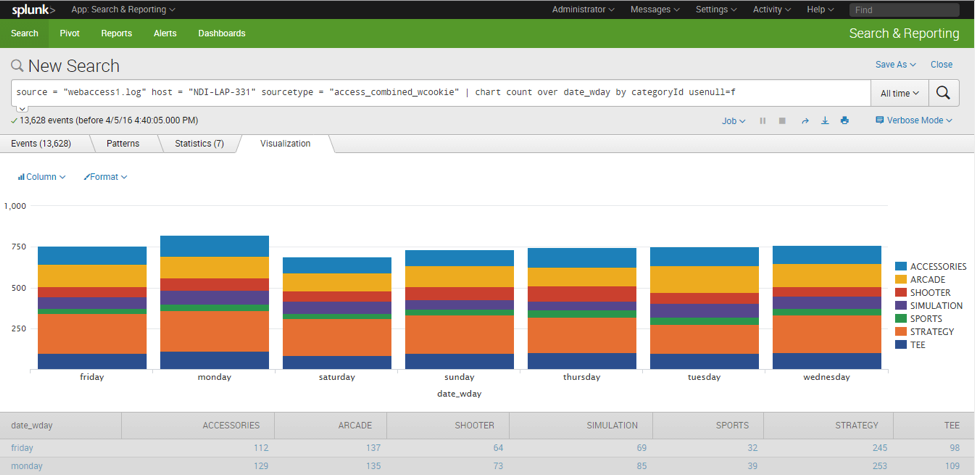
2. Specific section (category) access pattern: Splunk will get details for individual line items from the input file. For example, Splunk indexed the CategoryId from individual URLs in the file, where CategoryId was a query parameter. The following example demonstrates the traffic pattern for the individual category for each day:

splunk4

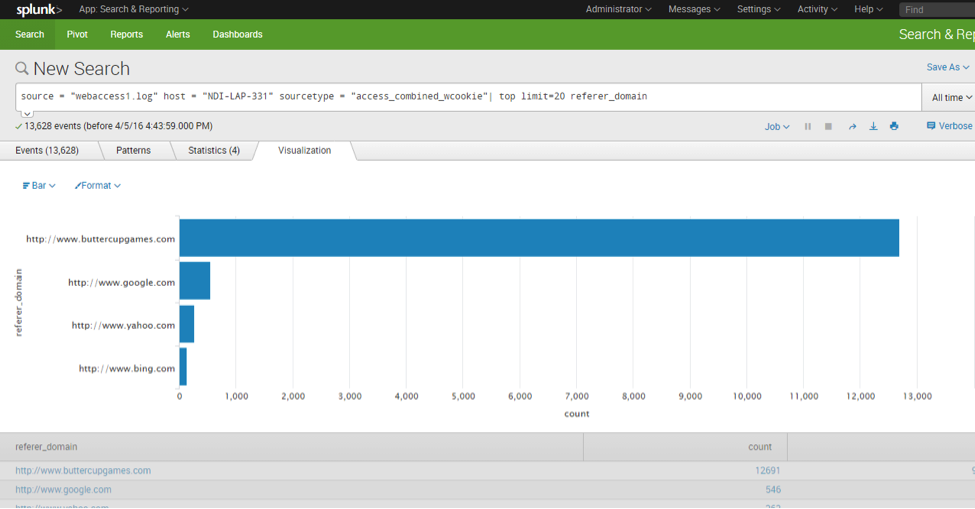
3. Referring sites pattern: Patterns for thesite referring to the website.

splunk5

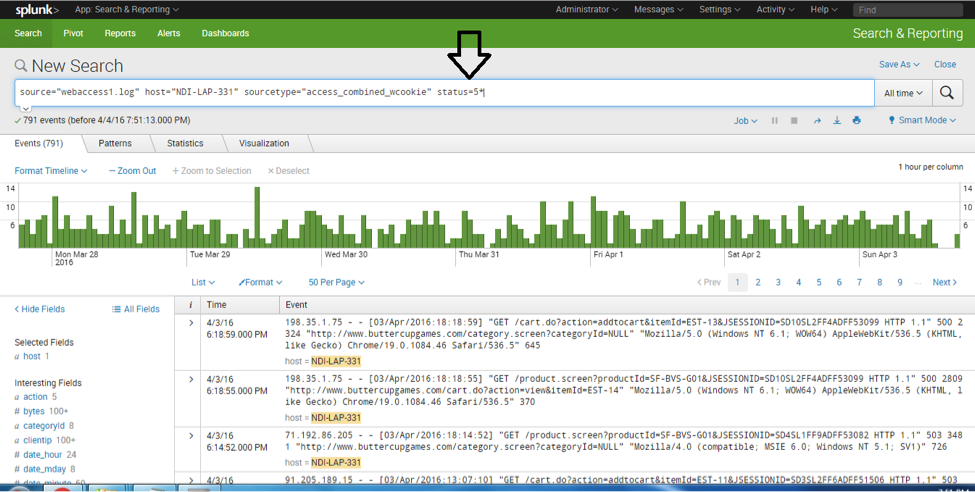
  • Error page pattern: Pattern for pages resulting in errors.splunk6

  • HTTP Errors (day-wise breakup).splunk7

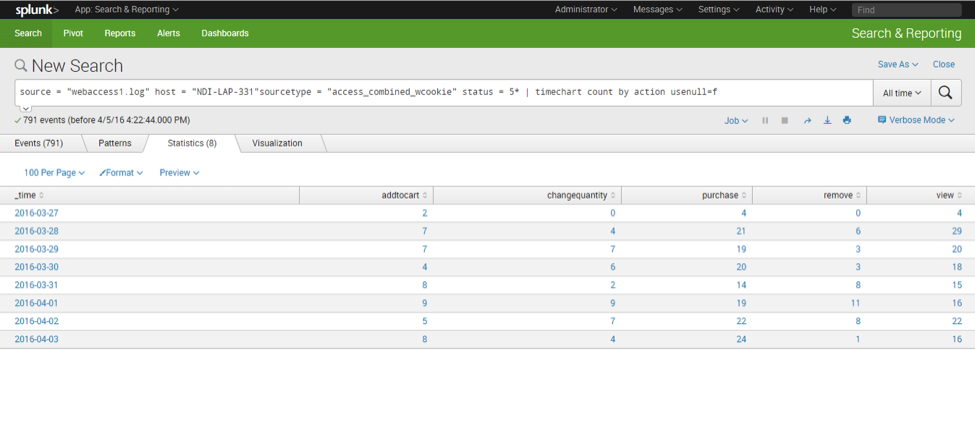
  • Pages/actions errors by each day patternsplunk8

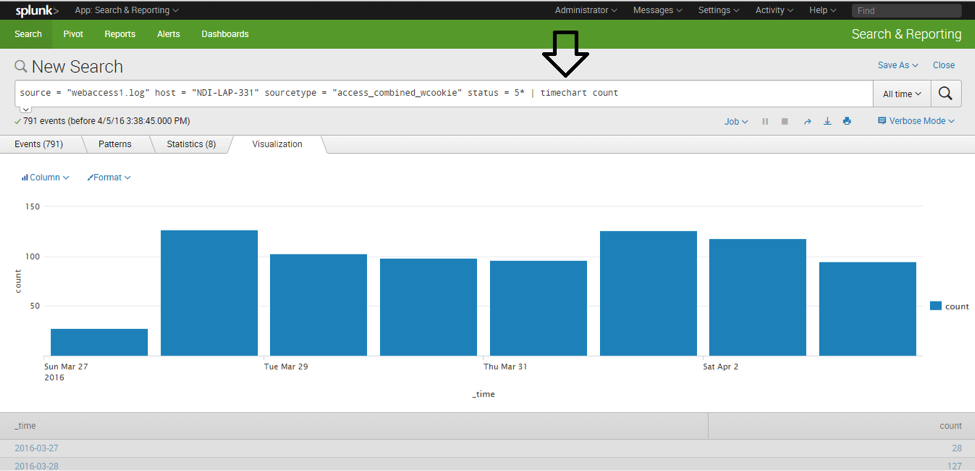
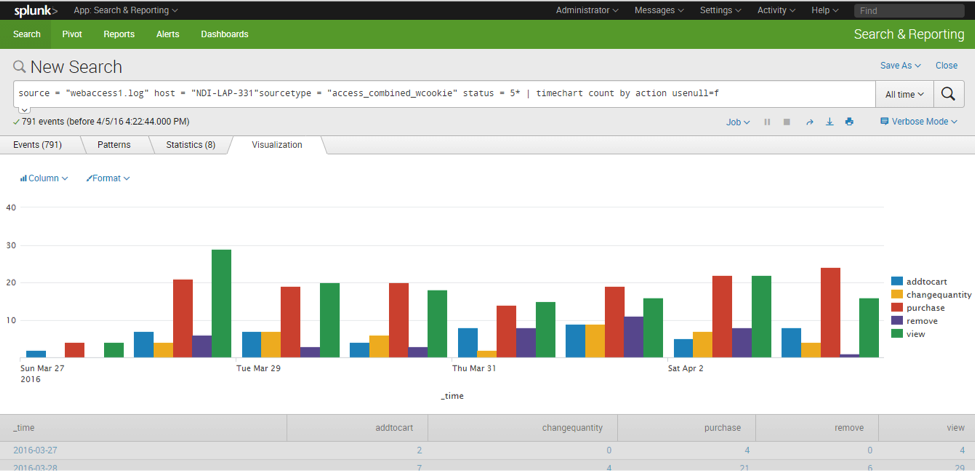
Here is a column chart representation of the errors per day, per page section:

splunk9

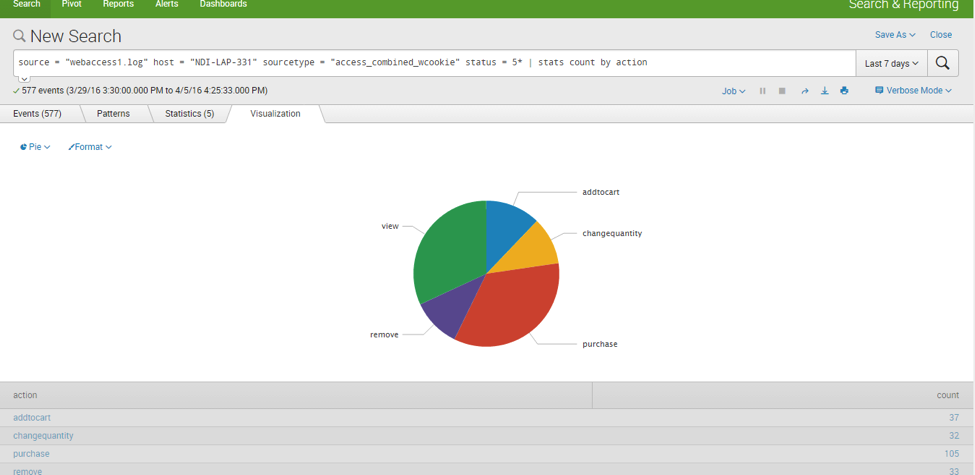
Here is a pie chart representation for a single day:

splunk10

In this blog post, I’ve touched just the tip of the iceberg; the possibilities with Splunk are immense.

If you have any questions or queries, please leave a comment below. I highly appreciate your feedback!

Developer of innovative software products and technology solutions hires Rivers to helm Product and Engineering organizations.

Fairfax, VA – June 6, 2016 – 3Pillar Global, a leading developer of innovative software products and technology solutions, announced today that Jonathan Rivers has joined the executive leadership team as Chief Technology Officer. Rivers will lead 3Pillar’s Product and Engineering organizations globally, as the company continues its aggressive growth both in the US and abroad.

“Jonathan’s technical depth and organizational vision make him the perfect fit for 3Pillar,” said David DeWolf, 3Pillar’s CEO. “He brings with him a wealth of diverse experience leading product and engineering teams that have built and managed massive, web-scale digital products. As software and technology continue to touch more areas of most businesses than ever before, we are thrilled to add a leader of Jonathan’s stature to the 3Pillar team.”

As Chief Technology Officer, Rivers will draw upon his experience leading product and engineering teams, to lead a team of more than 600 software engineers, product consultants, product managers, and user experience professionals.

“As a former client of 3Pillar’s, I know that the caliber of teams I will be leading is already quite high,” said Rivers. “I’m excited to work with the team at 3Pillar to continue to grow the business, but most importantly to increase the long-term value 3Pillar provides to clients.”

Most recently, Rivers was the Interim CTO at The Telegraph of London, where he served as Director of Service Delivery and Operations before becoming Interim CTO. He was also part of the leadership team that transformed PBS into a digital leader as their Sr. Director of Web Operations and Customer Support. Before joining PBS, he was the Executive Vice President of AdJuggler, a digital ad serving platform that was acquired by Zenovia. Rivers is a veteran of the United States Marine Corps and an avid motorcycle rider.

About 3Pillar Global

3Pillar Global builds innovative, revenue-generating software products, enabling businesses to quickly turn ideas into value. 3Pillar balances business-minded thinking with engineering expertise in disruptive technologies, such as mobile, cloud, and big data, to develop products that meet real business needs. To date, 3Pillar’s products have driven over $1 billion in revenue for industry leaders like CARFAX, PBS, and numerous others. For more information on the company, please visit https://www.3pillarglobal.com/.