Using Splunk for Data Analysis
Splunk is an enterprise platform to analyze and monitor a wide variety of data like application logs, web server logs, clickstream data, message queues, OS system metrics, sensor data, syslog, Windows events, and web proxy logs in many supported formats. Splunk provides a simple but powerful interface to quickly get insight out of the contextual data. In this post, I will showcase the power of data exploration using Splunk.
Analysis
To analyze the data, it must first be loaded into Splunk. I have downloaded a sample of Apache web server logs from http://www.splunk.com/base/images/Tutorial/tutorialdata.zip. The log shows events that are time-stamped for the previous 7 days.
To start, upload the Apache logs into Splunk as shown below:
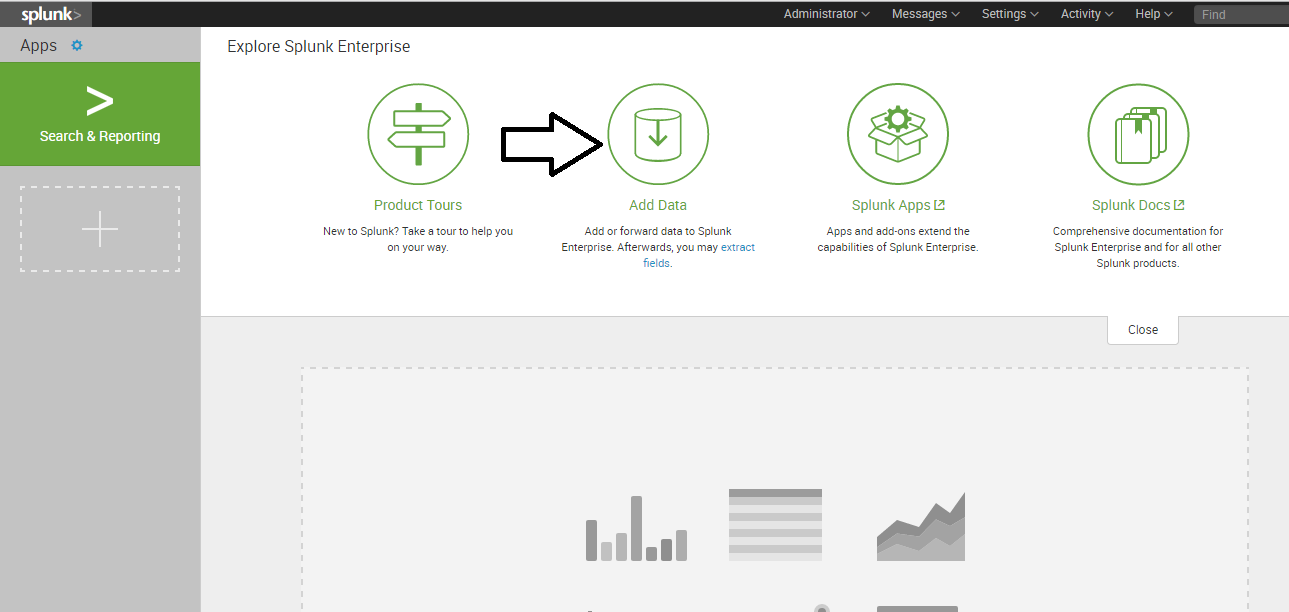
Upload data into Splunk
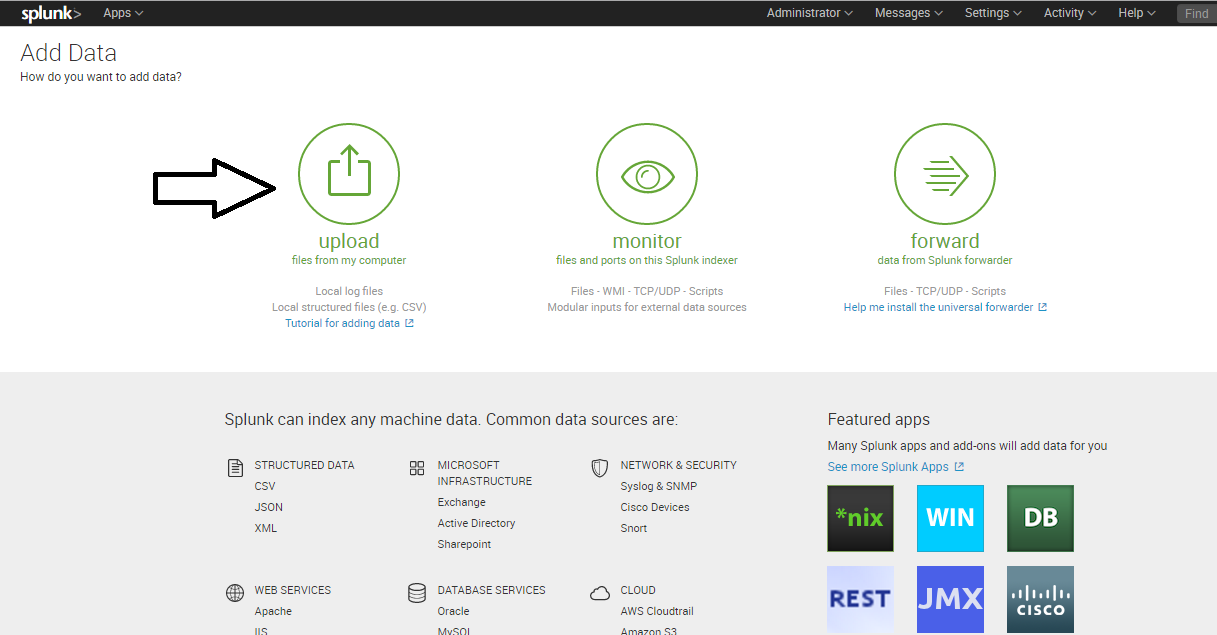
Add data into Splunk
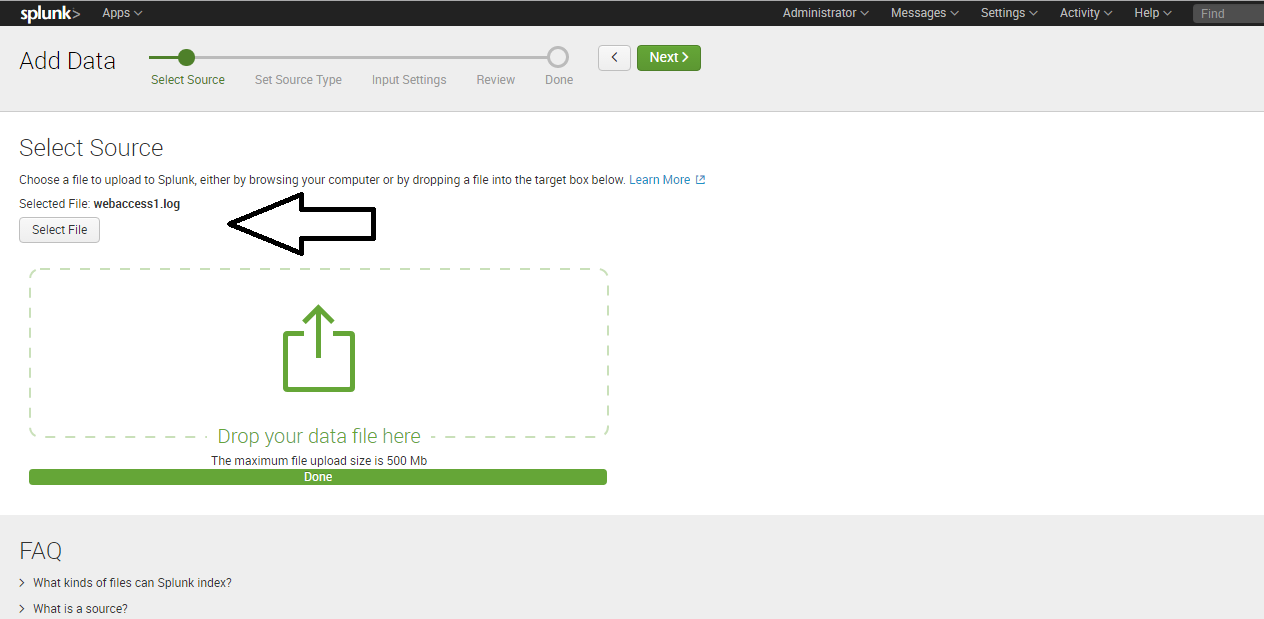
Follow the wizard steps. This will provide you with the search/query screen where you can do a detailed analysis over the data.
Here are some of the patterns that I derived out of the data:
1. Overall traffic patter: The overall pattern of traffic to the website is generated by default.
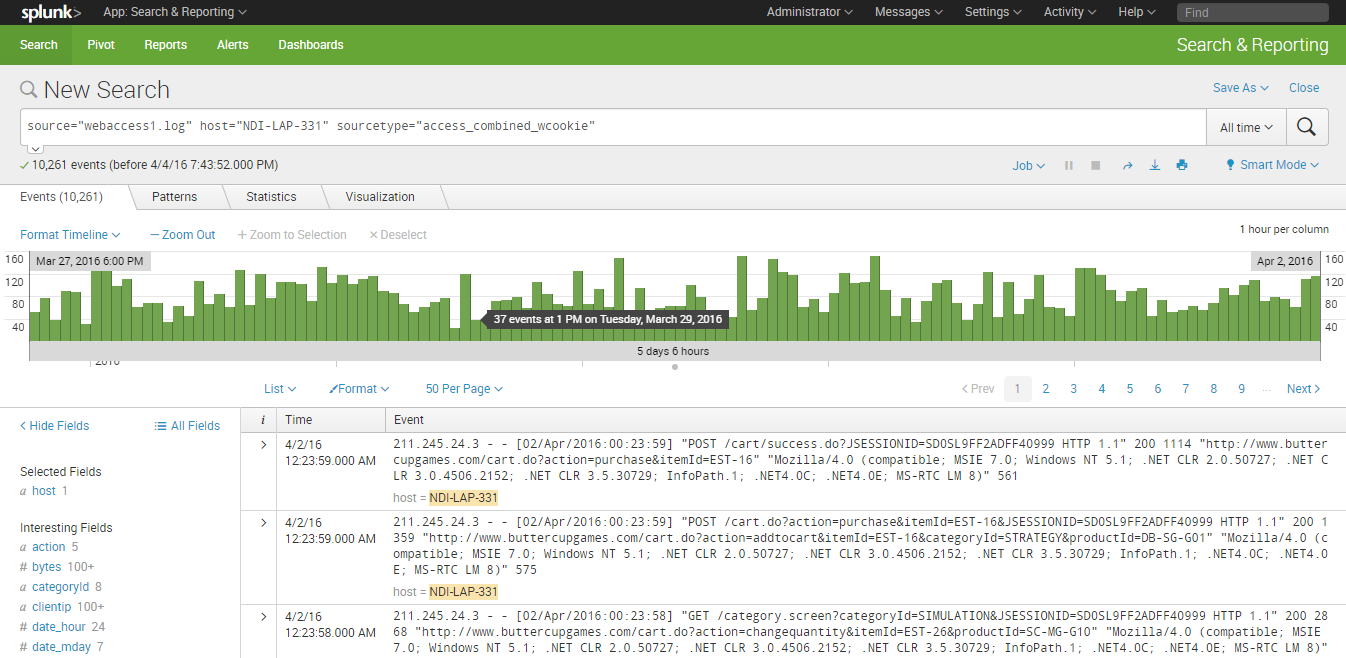
The pattern is for multiple days, but you can choose single day pattern from “date time range.”
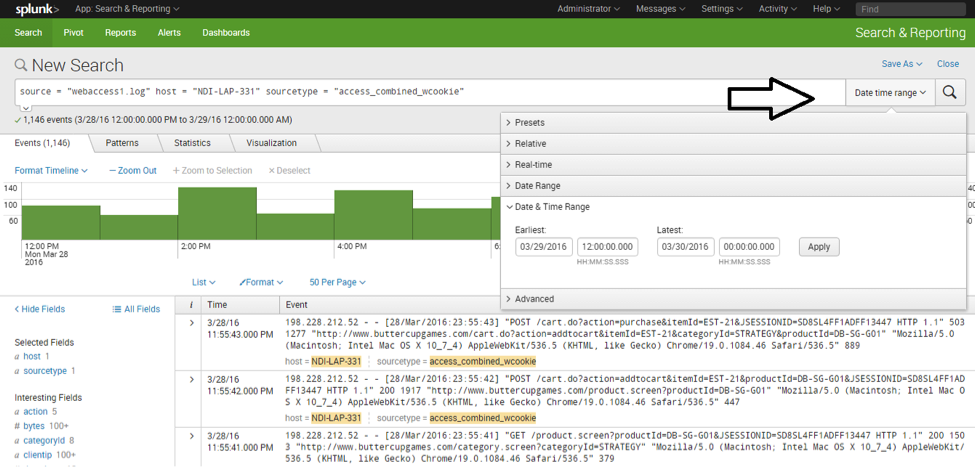
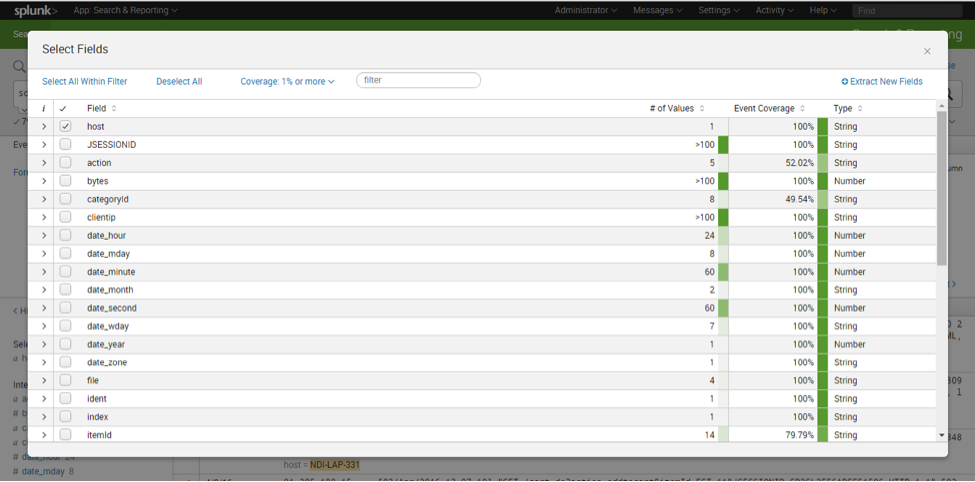
You can explore queries on more fields by clicking the “All Fields” link on the left.
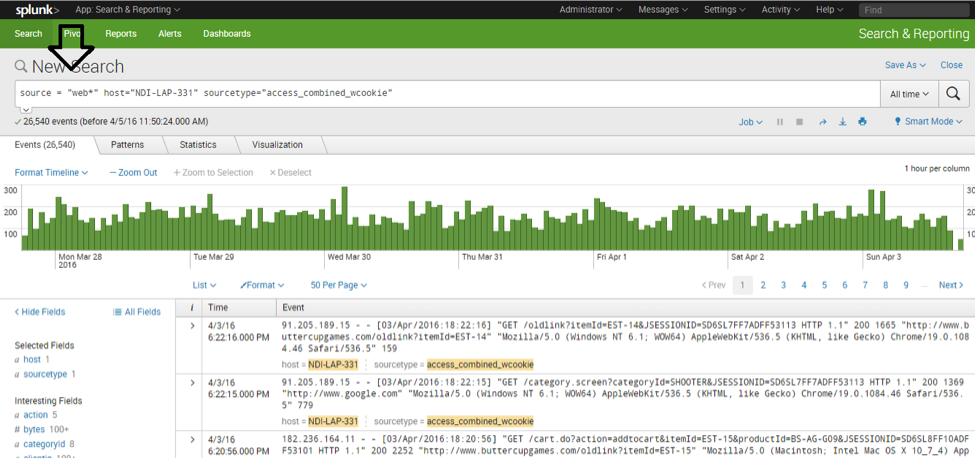
Multiple source files can be consolidated to do a comprehensive analysis. Upload a new log file and use a similar operation as shown below:
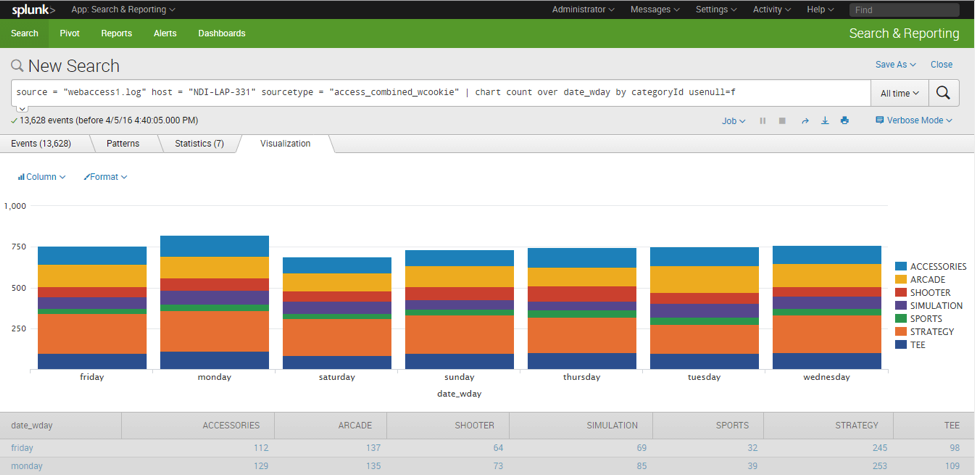
2. Specific section (category) access pattern: Splunk will get details for individual line items from the input file. For example, Splunk indexed the CategoryId from individual URLs in the file, where CategoryId was a query parameter. The following example demonstrates the traffic pattern for the individual category for each day:
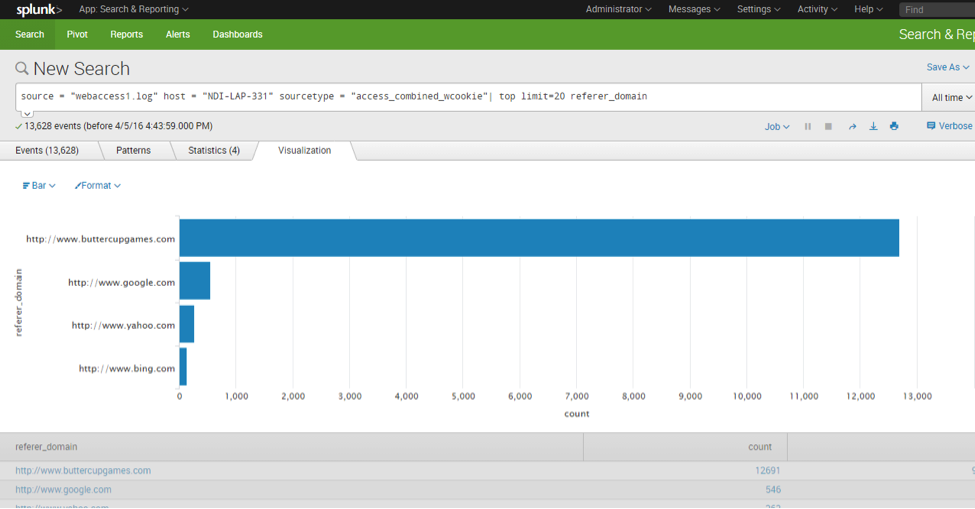
3. Referring sites pattern: Patterns for thesite referring to the website.
- Error page pattern: Pattern for pages resulting in errors.
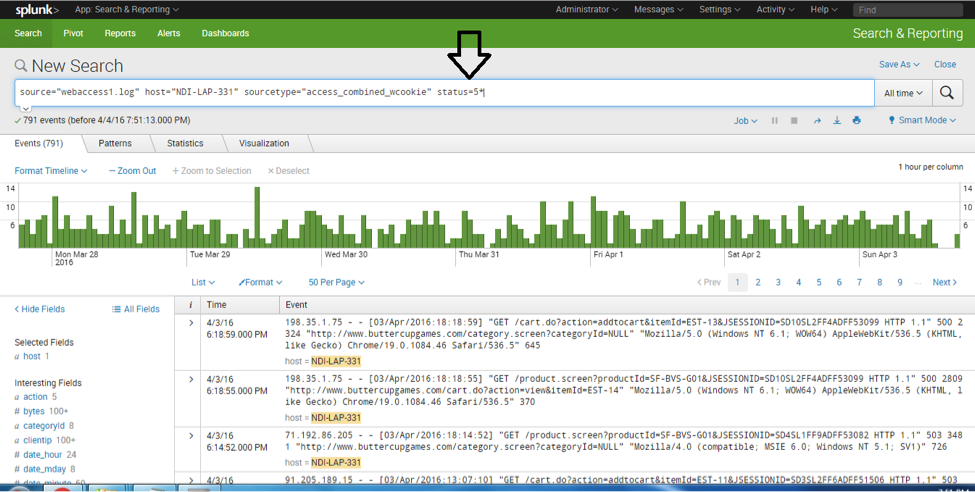
- HTTP Errors (day-wise breakup).
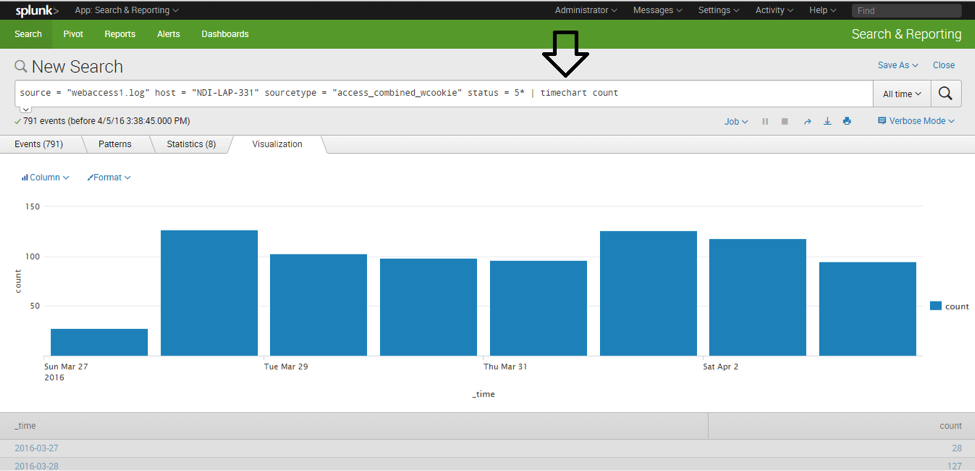
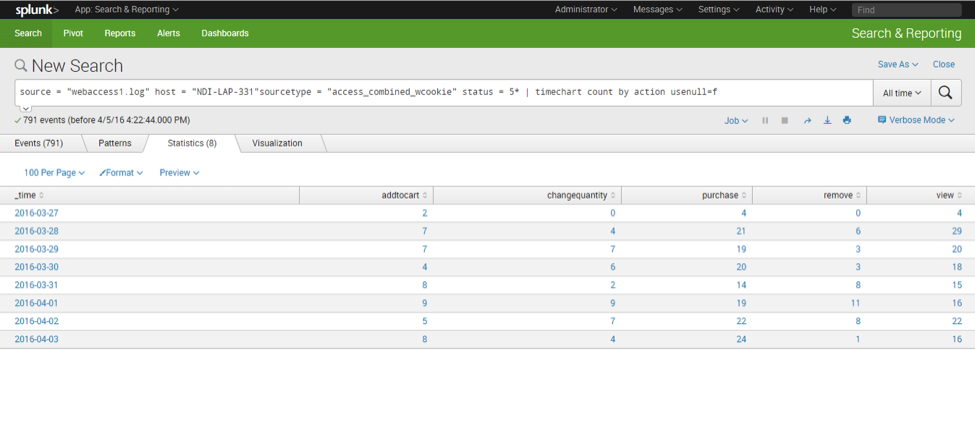
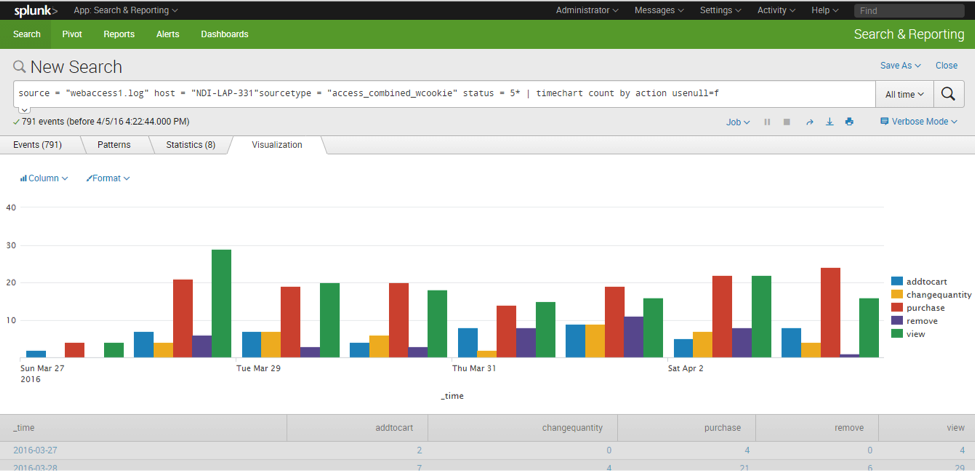
- Pages/actions errors by each day pattern
Here is a column chart representation of the errors per day, per page section:
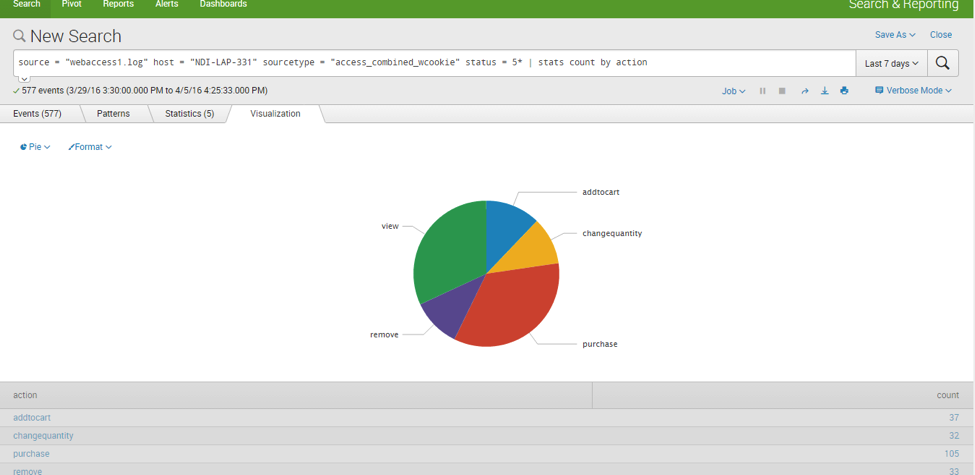
Here is a pie chart representation for a single day:
In this blog post, I’ve touched just the tip of the iceberg; the possibilities with Splunk are immense.
If you have any questions or queries, please leave a comment below. I highly appreciate your feedback!
Recent blog posts


Stay in Touch
Keep your competitive edge – subscribe to our newsletter for updates on emerging software engineering, data and AI, and cloud technology trends.