Utilizing Splunk for Operational Intelligence
Are you the one who owns the responsibility to understand business operations – a task that’s never been more important? As a result of the big data volumes and the diversity of new data sources exploding around us, many of the organizations are not yet able to fully utilize all of the opportunities present in their data. So, if you are planning on addressing this issue of supporting business operations – which has an ongoing IT complexity raising, – let me recommend Splunk.
What is Splunk?
Splunk gives you clear insight into traditional and new data sources with structured and unstructured data, so that the business opportunities, organizational threats, and performance issues are addressed as soon as possible, thereby enabling reactions that leverage or correct a given situation. Splunk makes machine data accessible, usable, and valuable to every stakeholder involved.
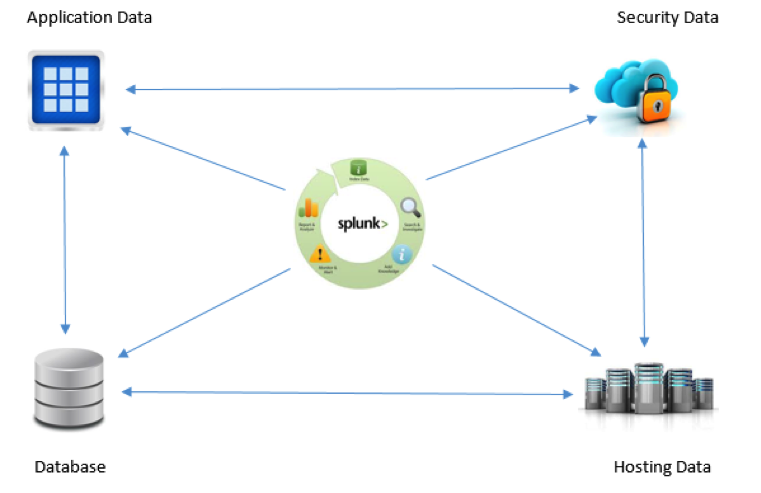
Splunk Builds Relationships Across Your Machine and App Data
Data Collection
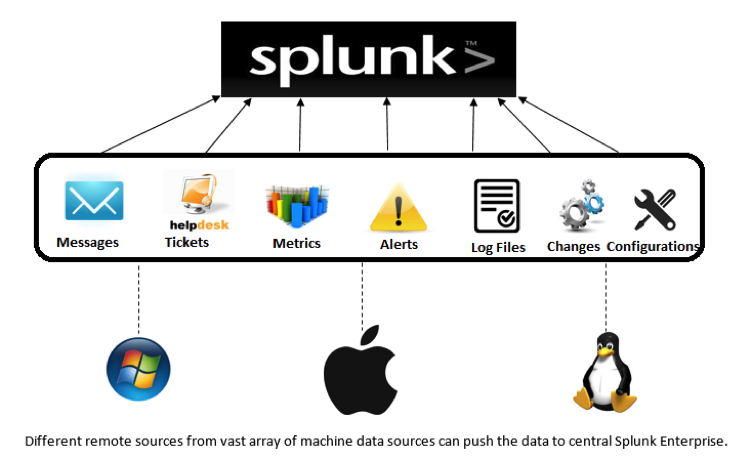
Machine data, which is related to different aspects like servers, applications, security, and networks, is generated over a distributed system and needs to be collected over a central system for performing analytical operations. Splunk Forwarders provide reliable and secure data collection from different sources and deliver it to the Splunk Enterprise or Splunk Cloud. Forwarders support a lightweight universal installation and are compatible with most machine data sources that exist in your technology infrastructure. Forwarders tag the metadata for its identification of a source, and also provide a configurable buffering, data compression, and a default transfer rate of 256 Kbps as the key capabilities. Forwarders communicate through TCP sockets – they can detect a network outage and automatically failover to another target indexer or start buffering events locally, thus guaranteeing message delivery.
Data Correlation
Distinct data sources on our system include app servers, virtual machines, mobile devices, databases, web servers, wire data from networks, operating systems, sensors, data streaming from packaged and custom applications, mainframes and much more. Correlating the events generated through all of these systems and determining the most relevant ones is a challenge. The analytical commands support in Splunk has allowed this correlation in ways that are not possible in other data collection systems, e.g. searching for a time based entry in one data source only if a successive event has taken place in another, like a pattern activity to be notified for across multiple data sources. It is easier to automate the results of these correlations to trigger an alert or to support a business metric, leading to decisive business ideas and intelligence.
Correlations Support
- Time and Geolocation – Data relationship can be identified based on time proximity or geolocation.
- Transaction – Related event series can be bundled into one. Track the duration or event count, etc.
- Sub-searches – Results of one search can be used in another. E.g. if the data of a second data source is only required if the first search meets the criteria.
- Lookups – To enhance/enrich the capability of correlation by providing a standard that could be used to detect a potential problem or some other significant action.
- Joins – Very similar to the joins in SQL. Similar fields can be identified in 2 different data sets and applied with inner and outer joins to provide a single view.
Operational Intelligence and Proactive Monitoring
The searching and reporting module in Splunk enables us to process days or months or years of logs quickly and to uncover the application and business trends that weren’t ever noticed. Splunk alerting helps us to turn the search results into scheduled alerts which could be integrated with an email or with a call-out mechanism.
The working and benefits of Splunk
- Splunk Forwarders collect live data streams and forward them to be indexed and instantly searchable.
- Meaningful data extraction from the indexed data in the form of fields at the search time.
- Dashboards to publish the business analytics or application performance from any of the searches or correlations.
- Any search results can be turned into scheduled alerts by providing the triggering condition of an event.
- Can identify critical events and trigger notifications to take further action.
- Predictive modelling through dashboards are helpful to business to avoid problems and grip the opportunities.
Customized Deployment Topologies
Splunk lets you decide the deployment architecture of the Splunk that you want to set up in your organization. Being a small, mid-sized, or a large enterprise, the requirement of the deployment topology can be adjusted as per your needs. Splunk’s capability to perform multiple roles via the same installation package enables us to achieve all the functionalities of the Splunk through the single server installation.
A single server installation with a few forwarders would look like:
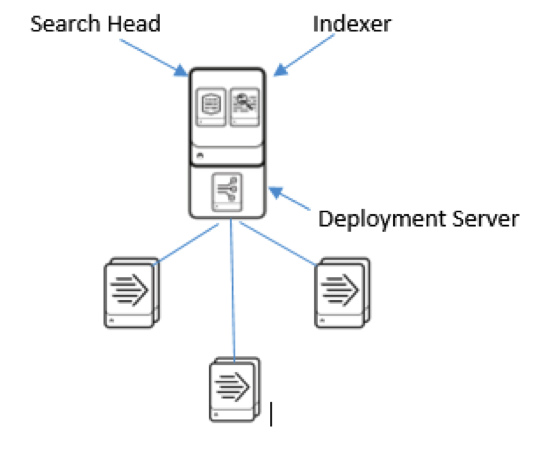
But if we want to explore and make use of the full capability of Splunk, we assign the dedicated servers to fulfill its every role. A multi-server installation looks like:
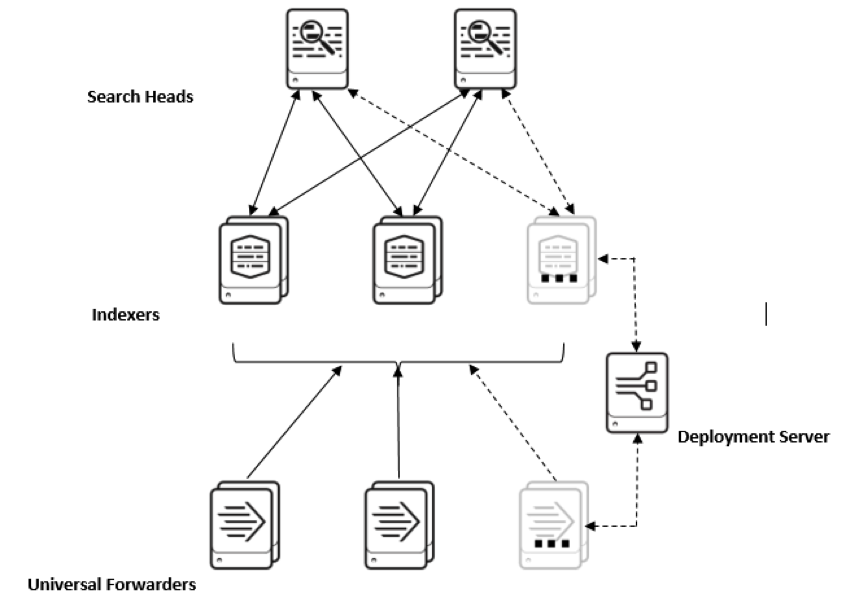
So, it lets us plan the deployment architecture providing the required flexibility in our hands, which helps us to start with a small departmental installation and scale the same setup to the organizational level when it is needed.
This will allow you to answer the complex business analytical questions by extracting and correlating all the meaningful data, as well as allow for the exploration of new opportunities to optimize the business services.

Stay in Touch
Keep your competitive edge – subscribe to our newsletter for updates on emerging software engineering, data and AI, and cloud technology trends.

